Precision Agriculture
Know your yield before harvest day.
CropKern fuses multispectral satellite imagery with in-field soil sensor readings to forecast crop yield at the 10-meter parcel level - weeks before you pick.
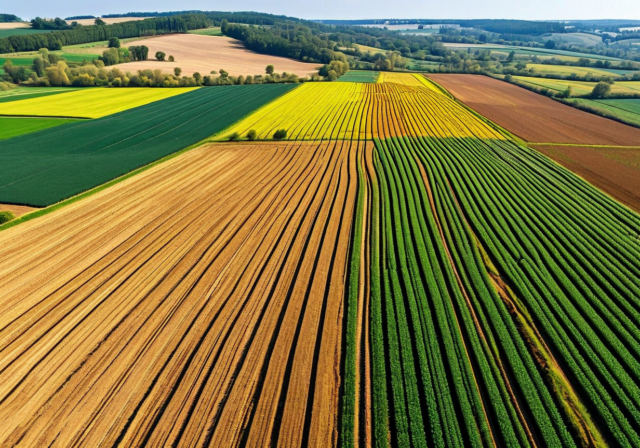
CropKern fuses multispectral satellite imagery with in-field soil sensor readings to forecast crop yield at the 10-meter parcel level - weeks before you pick.
CropKern processes daily Sentinel-2 passes alongside readings from LoRaWAN soil sensor nodes to give agronomists a single decision-ready view.
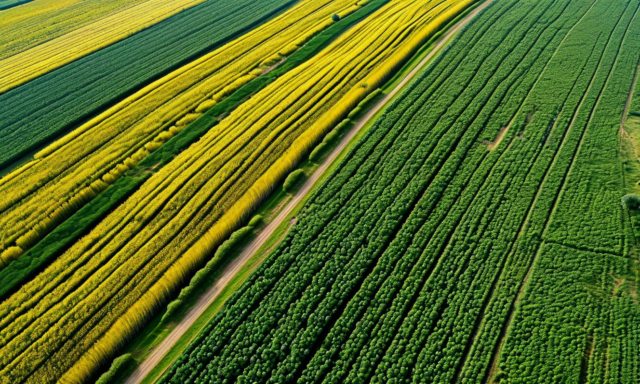
Daily ingestion of Sentinel-2 and PlanetScope bands. NDVI, NDWI, and EVI indices computed per parcel. Cloud-mask correction runs automatically so you never lose a data point.
Merges in-field sensor telemetry (soil moisture, EC, temperature at 15 cm and 40 cm depth) with satellite-derived evapotranspiration estimates to build a full root-zone water balance.
Gradient-boosted regression models trained on six growing seasons of ground-truth yield data. Forecasts update every 72 hours. Agronomists receive a per-parcel confidence interval, not a single point estimate.
Converts root-zone deficit calculations into pump run-time recommendations for drip, pivot, and furrow systems. Output formats include JSON API, valve-controller CSV, and a printable field schedule.
Upload boundaries as GeoJSON or draw them on the map editor. The platform handles overlapping parcels, field splits, and seasonal rotation records without data loss.
Automated NDVI deviation alerts flag canopy stress before visible symptoms appear. Early detection of nitrogen deficiency, waterlogging, and pest pressure patterns.
Sentinel-2 Level-2A tiles and LoRaWAN sensor packets arrive on a 24-hour cycle. Atmospheric corrections and sensor drift compensation run in the preprocessing queue.
Per-parcel vegetation indices, soil moisture profiles, and growing-degree-day accumulations are extracted and joined into time-series feature vectors.
The yield model scores each parcel and produces a probability distribution over expected output tonnage. Weather scenario analysis adds rain and temperature branches.
Irrigation recommendations push to the farmer dashboard, mobile app, and directly to compatible valve controllers via the REST API.
The CropKern dashboard overlays yield forecasts, irrigation recommendations, and stress alert polygons on a single parcel map. Agronomists can drill down to any 10-meter cell to see the underlying spectral and sensor data that drove each recommendation.
Integrated crop scouting notes sync from the mobile app, letting field teams annotate anomalies directly on the satellite basemap.
Explore the Platform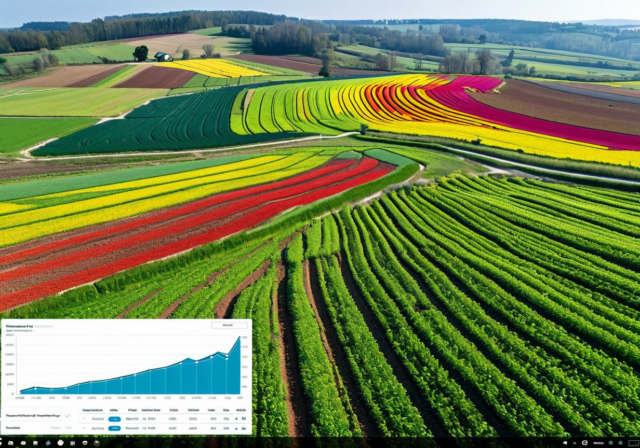
NDVI saturates above LAI 3.5. Here is what the red-edge band adds and when it matters.
Read more →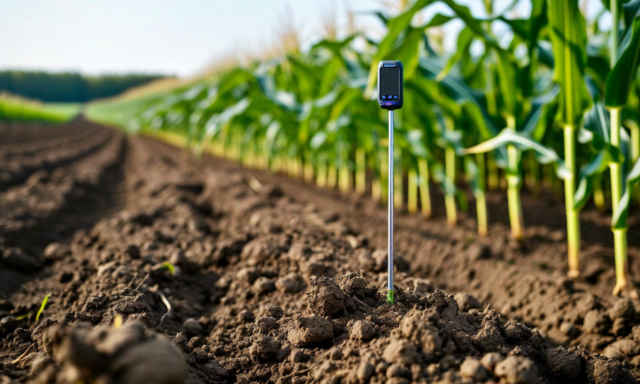
Evapotranspiration minus precipitation does not equal depletion. Here is the full accounting.
Read more →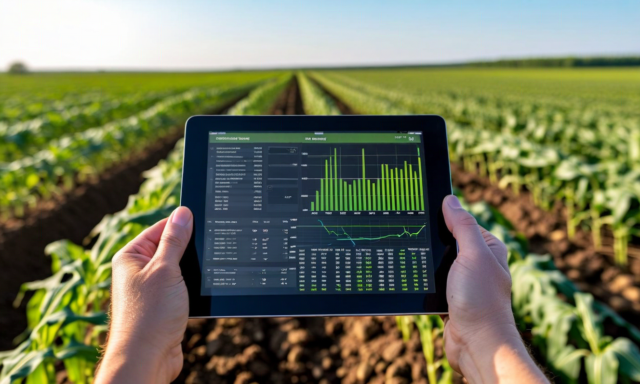
Models trained on 2019 data systematically underestimate in drought years. The fix is not retraining.
Read more →We onboard new growers in under two weeks. Upload your parcel boundaries and our team connects your existing sensor network or ships a starter kit.
Request a Demo